
For several months now, a new positioning analysis platform has been the talk of the town: Ranxplorer. The tool, which was launched at the end of 2016, can be used to estimate a wide range of statistical data for a site, such as traffic and positioned keywords, as well as to compare competitors in terms of SEO. Here you’ll find an overview of Ranxplorer’s features, to understand how it can help you track and optimize your visibility on Google and other search engines.
Ranxplorer and its benefits
In addition to the possible uses described above, this platform has many other benefits. A simple, user-friendly interface, cross-referencing of SEO and SEA data and valuable applications. Among these applications, it’s important to mention the data comparison tool.
Thanks to ranxplorer, you can compare changes in the positions and traffic of the keywords positioned over a given period. For example, you have an e-commerce site that sells watches at affordable prices and you want to position yourself on terms such as “cheap watches“. Thanks to the tool, you can compare the evolution of your positions on this term between two given periods. By selecting September 2017 in the first comparison column and March 2017 in the second, you can analyze the evolution of your positions over these 6 months.

To access this function, go to the Natural results -> Keywords tab and click on the drop-down menu displaying the month to be analyzed. The comparison function is at the very bottom of the drop-down menu.
Essential features for referencing
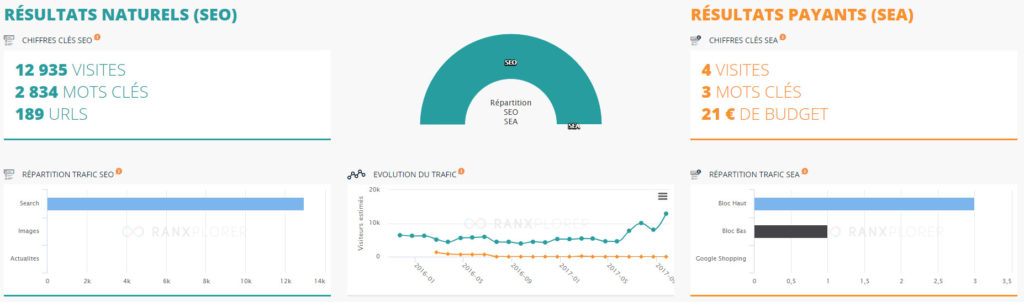
The Ranxplorer platform is a large toolbox capable of analyzing a wide range of data about a site, divided into two main categories: natural search engine optimization (SEO) and paid search engine optimization (SEA). The ‘overall summary’ tab shows the most significant figures for organic results (SEO) and sponsored results (SEA).
In this summary, you will find
- Traffic attributable to natural referencing, paid referencing and total monthly visits;
- The number of keywords positioned in SEO and SEA and those that bring you the most traffic;
- The number of URLs indexed;
- Your competitors in terms of search engine optimisation;
Another interesting statistic to look at is the percentage split between SEO and SEA. This gives a good idea of how complementary the two levers are when both are used.
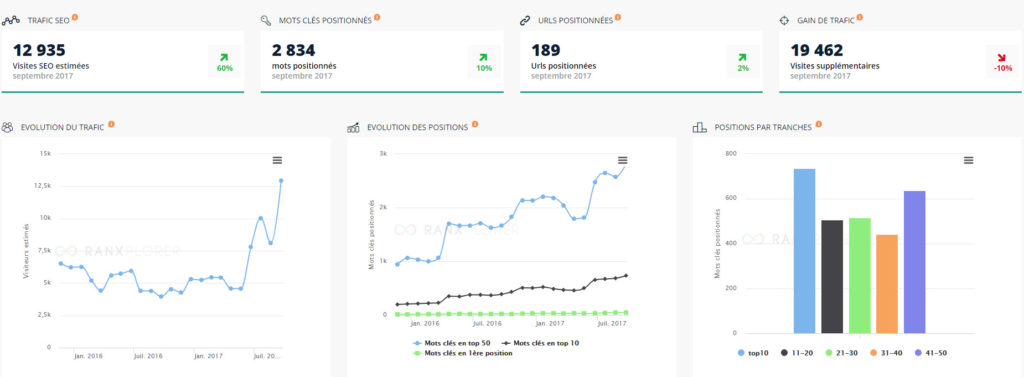
Natural results
Thanks to the SEO tab, you can obtain the main metrics you need. The natural results summary includes a traffic evolution curve, a position evolution graph with the keywords in first position, top 10 and top 50.
Note that Ranxplorer also lets you download these curves in several formats or print them out directly.
In addition to the overview, the menu gives you access to a number of categories, the main ones being :
Keywords: here you’ll find your keywords, their position, their associated search volume and their level of competition.
URLs: this tab shows you the number of URLs indexed, the number of keywords associated with each page, the traffic each page generates and how it is changing. You can also search for and filter the pages that interest you.
Competitors: a list of competitors is displayed here, along with a number of metrics. Two tabs allow you to carry out an overall analysis: the history of the competition (with the option of comparing several competitors), and the intensity of the competition on a second tab.
Ranxplorateur: this is an interesting indicator for quickly evaluating a site’s URLs.
Missed keywords: is your keyword strategy optimal? This tab lists terms used by your competitors that are likely to be of interest for your site.
The “Short-term gain” and “Long-term gain” tabs show traffic trends based on the assumption of a 5-position improvement for each URL already positioned in the top 50. You can filter by “Familiarity traffic”, which is identified by the presence of the domain name in the URL, unlike “Non-familiarity traffic”. Filtering by keyword is also possible.
Paying results
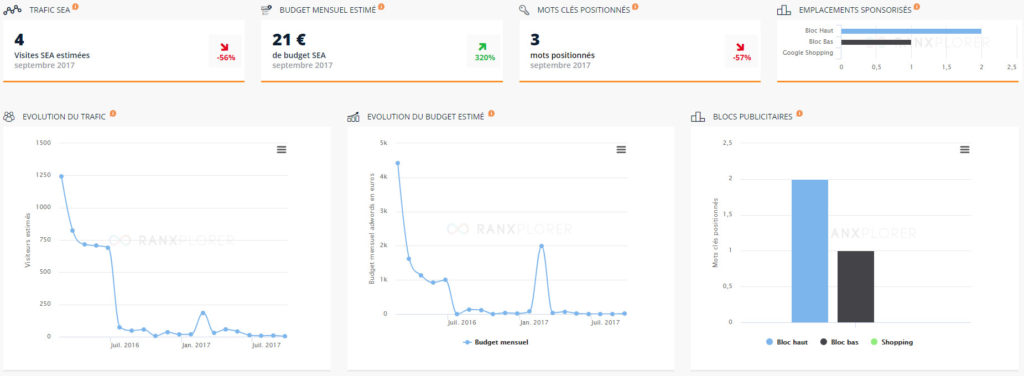
The presentation of SEA data on Ranxplorer is similar to the SEO results section. However, the data used is different.
On the SEA side, here are some of the elements you’ll have access to:
SEA traffic: this is the number of visits from sponsored links. You need to be careful to look at the period selected to avoid making any mistakes.
Estimated monthly budget: this is the estimated budget based on the site’s positioning by keyword and the maximum CPC observed for this keyword.
Positioned keywords: these are the keywords on which the site is displayed on the SEA results pages.
Sponsored positions: the number of keywords positioned by type of block (top or bottom). It should also be noted that Google Shopping results are also counted.
In addition to these figures, you will also be able to evaluate the evolution of your traffic, your estimated budget and your competitors identified on the basis of your keyword strategy.